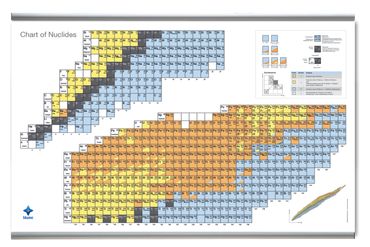
Technical data Chart of nuclides - Wall map, 200 x 141 cm (short version)Article no: BLU-NK-WANDK-KV-EN  Function and Applications The blume chart of nuclides shows didactically optimized over 3,000 currently experimentally proven nuclides. The map provides over 10,000 highly precise data based on the well-respected National Nuclear Data Center of the Brookhaven Institute (USA). For teaching, studying and research in various departments, the great didactic value is in particular the readability optimized presentation of the data in interaction with the format adapted to the respective field of application. SPECIFICATIONS: For each nuclide, if known, the following values are given: - Element symbol - Mass number A, Atomic number Z, Neutron number (N) - half-life period - stable nuclides/ occurrence of stable nuclide - Types of decay: α, β- , β+/electron capture, spontaneous fission - Relative occurrence of the type of decay due to colour subdivision DETAILS OF THE PRODUCT: Flat hanging polyester material incl. elegant aluminium poster strip system for effortless wall mounting. Format: 200 cm x 141 cm REFERENCES: Evaluate Nuclear Structure Data File (ENSDF): nndc.bnl.gov. Status: June 2017. The values published on the chart of nuclides correspond to the current state of science and are permanently updated. |
Robert-Bosch-Breite 10 – 37079 Göttingen – Germany
www.phywe.com

